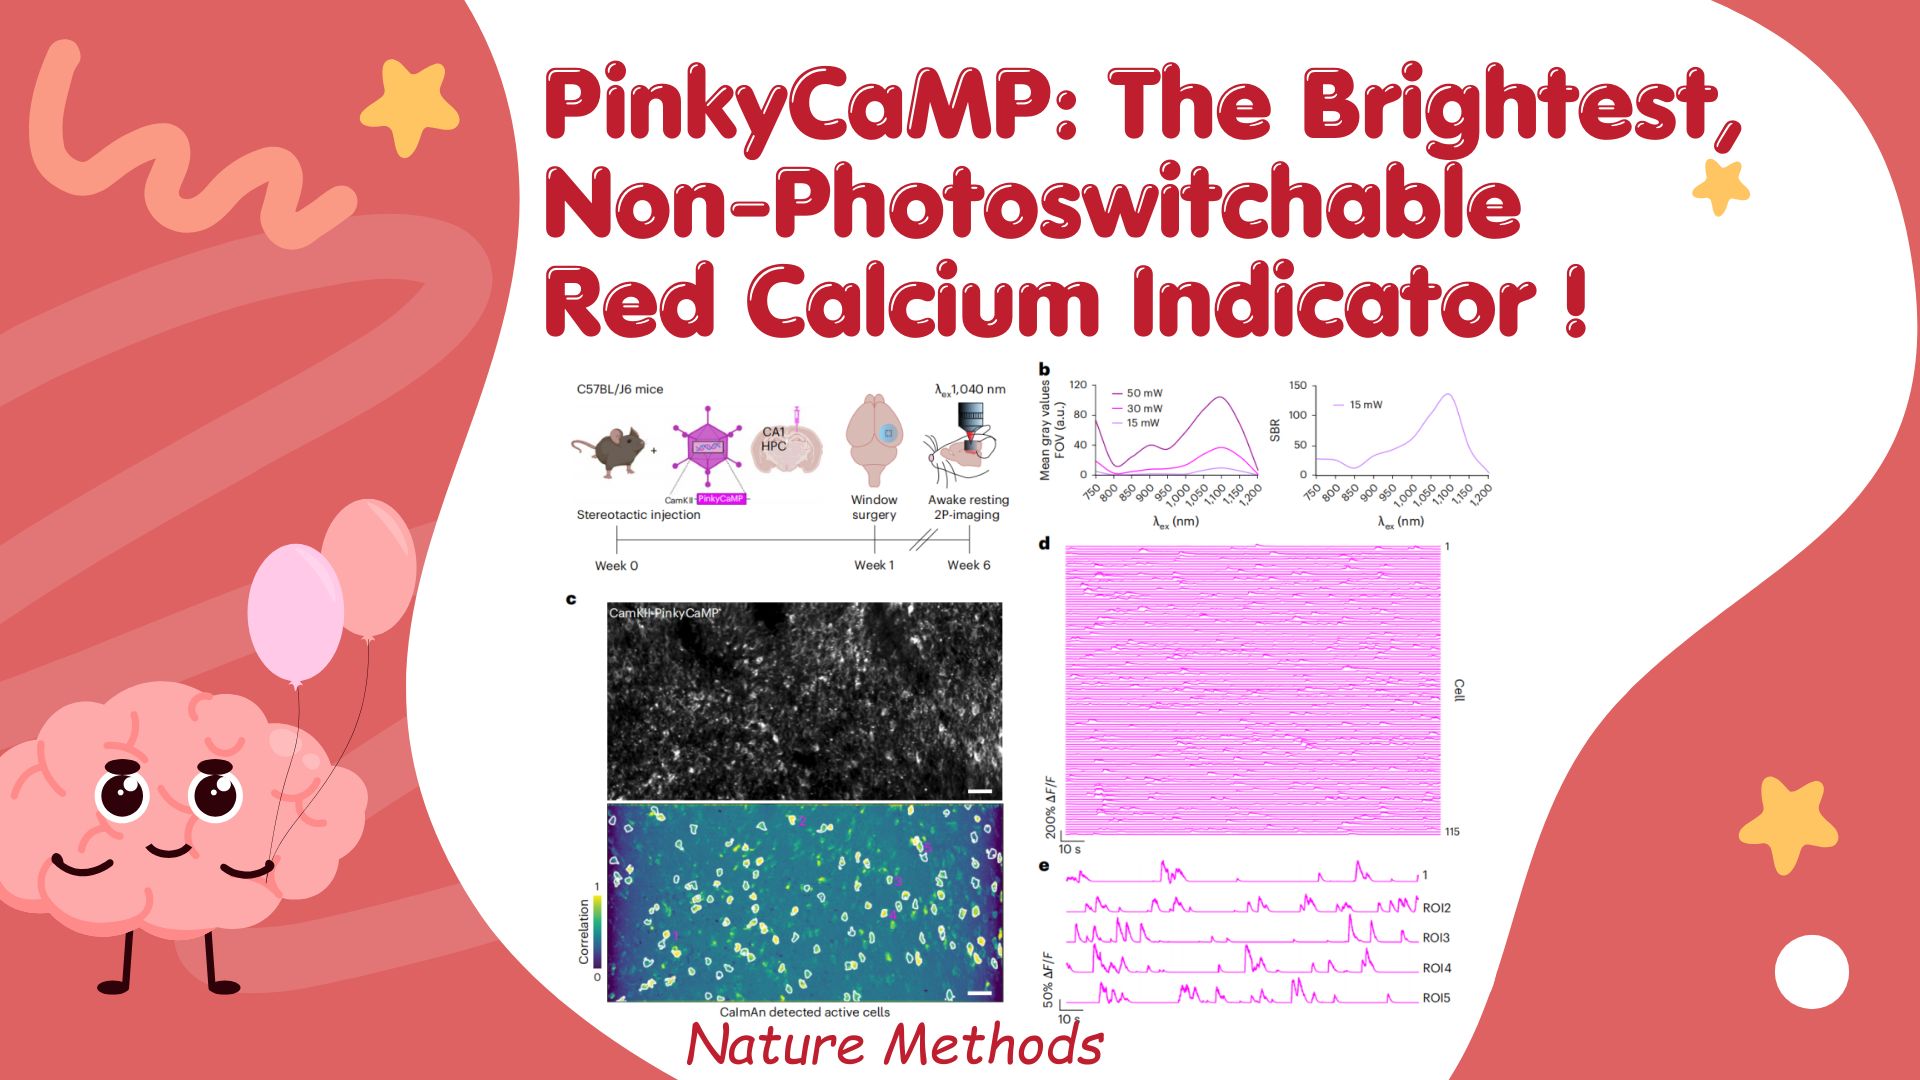
Existing lactate-sensing tools can detect lactate in vivo, but they suffer from low spatial resolution (unable to reach single-cell level) and high invasiveness (tissue-disruptive). Green fluorescent sensors such as eLACCO2.1 allow minimally invasive imaging, yet their spectra overlap with GCaMP calcium indicators, making it impossible to monitor lactate and neuronal activity simultaneously.
A 2025 Nature Communications article titled “A red fluorescent genetically encoded biosensor for in vivo imaging of extracellular L-lactate dynamics” reports the development of R-eLACCO2.1, a red fluorescent genetically encoded extracellular L-lactate biosensor. Through directed evolution (derived from R-eLACCO0.1 after multiple rounds of engineering, incorporating 25 mutations) and optimized membrane targeting using an Igκ leader and COBRA anchor, R-eLACCO2.1 achieves superior sensitivity to extracellular L-lactate elevation in vivo and provides spectral orthogonality compared to previous green fluorescent sensors.
Development of the Red Fluorescent Genetically Encoded L-Lactate Sensor R-eLACCO2 and Optimization of Its Cell-Surface Targeting
The researchers first generated the red fluorescent L-lactate sensor prototype R-eLACCO0.1 (ΔF/F = 0.2) by replacing the circularly permuted GFP (cpGFP) in the green sensor eLACCO1 with circularly permuted mApple (cpmApple). Subsequent directed evolution yielded R-eLACCO1 (ΔF/F = 4.3). Introducing a Leu79Ile mutation produced a low-affinity variant, R-eLACCO1.1 (ΔF/F = 3.9, Kd = 1.4 mM), but this variant showed dim fluorescence on the cell surface and limited responsiveness (ΔF/F ≈ 1).
Using R-eLACCO1 as a template, the team performed 1 round of site-saturation mutagenesis and 11 rounds of full-gene random mutagenesis, generating R-eLACCO1.93 (ΔF/F = 18). Adding the Ile191Val mutation yielded the highly optimized R-eLACCO2, containing 25 mutations in total. Characterization showed that R-eLACCO2 can function as a fluorescence lifetime imaging microscopy (FLIM) sensor, enabling detection based on changes in fluorescence lifetime (τ)—an intrinsic molecular property unaffected by concentration or excitation power. Cryo-EM resolved its lactate-bound structure at 2.7 Å, revealing electrostatic interactions between the chromophore and Lys211 and identifying Lys211 as a key regulator of fluorescence.
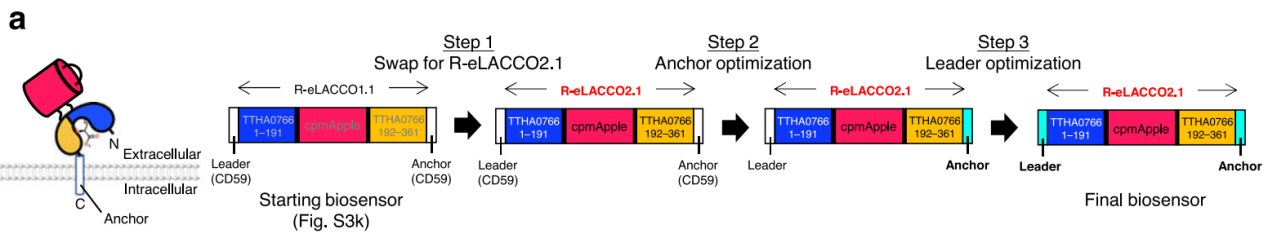
For cell-surface targeting, building on experience from the original eLACCO2.1 study, the researchers screened various GPI-like anchoring domains (CD59, COBRA, GFRA1), identifying that these domains enabled efficient membrane localization of the low-affinity variant R-eLACCO2.1. Among 14 N-terminal signal peptides, HA, Igκ, and pat-3 produced the strongest fluorescence. Further combinatorial screening revealed that Igκ signal peptide + COBRA anchor was the optimal pair, yielding ΔF/F ≈ 5 for R-eLACCO2.1—five times higher than R-eLACCO1.1 with the CD59 signal-anchor combination.
Figure 1. Overview of cell-surface targeting optimization for L-lactate sensors.
Characterization of R-eLACCO2 Variants in Live Mammalian Cells
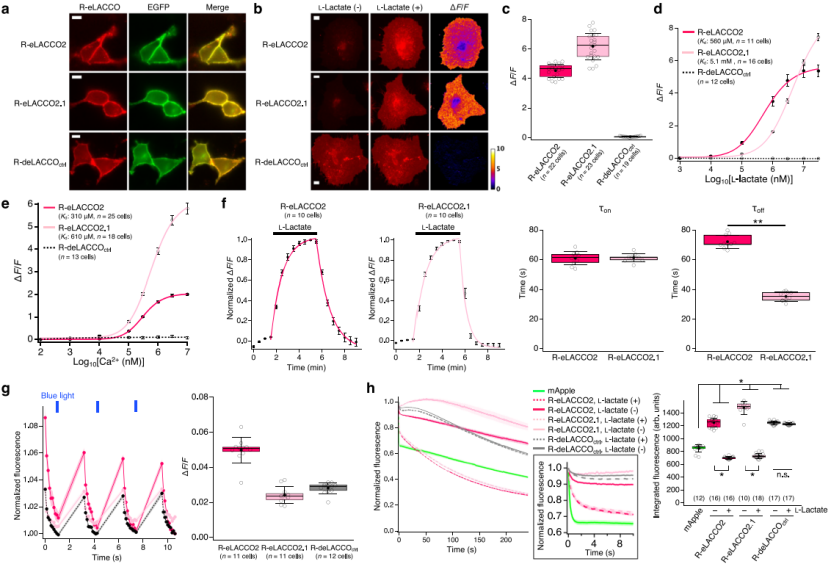
R-eLACCO2 variants with optimized signal peptide (Igκ) and anchoring domain (COBRA) were evaluated (Fig. 2a). When expressed on HeLa cell surfaces, R-eLACCO2 and R-eLACCO2.1 showed ΔF/F values of 4.5 ± 0.1 and 6.2 ± 0.2, respectively, in response to 10 mM L-lactate (Fig. 2b–c). In comparison, the control sensor R-deLACCOctrl localized correctly to the membrane but showed no response to L-lactate (Fig. 2a–d).
Their apparent in situ Kd values for L-lactate were 560 μM (R-eLACCO2) and 5.1 mM (R-eLACCO2.1) (Fig. 2d). Their apparent in situ Kd values for Ca²⁺ were 310 μM and 610 μM, respectively (Fig. 2e), both below typical extracellular Ca²⁺ levels in the brain. The association rates (τon) were 61 ± 5 s / 61 ± 3 s, and dissociation rates (τoff) were 72 ± 4 s / 35 ± 3 s (Fig. 2f).
Because cpmApple-based sensors are prone to blue-light–mediated photoactivation and show complex photostability, HeLa cells expressing the R-eLACCO variants were exposed to 470 nm blue light (~4 mW/cm²). Fluorescence increased slightly (Fig. 2g), but the photoactivation ΔF/F was far smaller than the lactate-induced response and displayed faster kinetics (Fig. 2c–f).
Without lactate, R-eLACCO2 and R-eLACCO2.1 showed integrated fluorescence (IF) values of 1251 ± 18 and 1485 ± 32, respectively—higher than mApple. With lactate, their photostability decreased, with IF dropping to 702 ± 5 and 731 ± 9 (Fig. 2h). In contrast, R-deLACCOctrl exhibited photostability consistently higher than mApple.
Figure 2. Characterization of R-eLACCO2 variants in live mammalian cells.
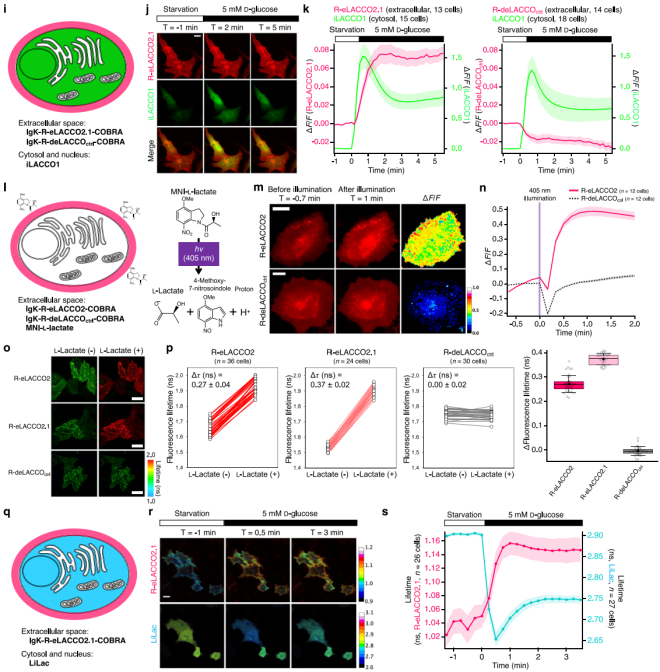
To observe spatiotemporal L-lactate dynamics, glucose-starved T98G glioblastoma cells co-expressing R-eLACCO2.1 (extracellular) and iLACCO1 (intracellular) showed synchronous fluorescence increases after glucose stimulation (Fig. 3j–k), whereas R-deLACCOctrl fluorescence decreased (likely due to pH drop accompanying lactate accumulation; Fig. 3k).
HeLa cells incubated with caged L-lactate (MNI-L-lactate) and R-eLACCO2 were illuminated with 405 nm light: fluorescence first decreased (due to proton release and pH reduction) and then increased (Fig. 3m–n). R-deLACCOctrl showed only a transient decrease, indicating compatibility with green fluorescent sensors and UV-light–based uncaging tools.
In FLIM experiments, both R-eLACCO2 and R-eLACCO2.1 exhibited significantly increased fluorescence lifetimes after 10 mM L-lactate treatment (Fig. 3o–p). In T98G glioblastoma cells co-expressing R-eLACCO2.1 (extracellular) and LiLac (intracellular FLIM lactate sensor), glucose stimulation increased R-eLACCO2.1’s fluorescence lifetime while decreasing LiLac’s (Fig. 3q–s), confirming that R-eLACCO2 variants can serve as FLIM sensors for detecting extracellular lactate dynamics in living cells.
Figure 3. Direct visualization of spatiotemporal L-lactate dynamics using R-eLACCO2 variants.
Validation of R-eLACCO2 Variants in Neuronal Cells and Suprachiasmatic Nucleus (SCN) Brain Slices
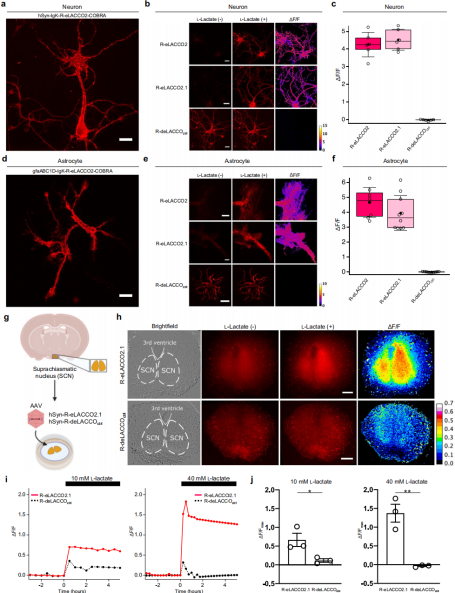
To characterize the performance of R-eLACCO variants on neuronal surfaces, the probes were placed under the control of the neuron-specific promoter hSyn and transfected into primary rat cortical neurons. Neurons expressing R-eLACCO2 showed bright membrane-localized fluorescence (Fig. 4a). Upon bath application of 10 mM L-lactate, R-eLACCO2 and R-eLACCO2.1 exhibited ΔF/F values of 4.3 ± 0.3 and 4.5 ± 0.2, respectively, while R-deLACCOctrl showed no response (Fig. 4b–c).
Using constructs driven by the astrocyte-specific promoter gfaABC1D, the probes were also correctly expressed on the surface of primary rat cortical astrocytes (Fig. 4d). After adding 10 mM L-lactate, R-eLACCO2 and R-eLACCO2.1 showed ΔF/F values of 4.7 ± 0.4 and 3.9 ± 0.4, respectively (Fig. 4e–f), whereas R-deLACCOctrl again showed no response.
To evaluate whether R-eLACCO2.1 can detect lactate in intact tissue, brain slices from mice expressing the probe via AAV delivery were prepared from the suprachiasmatic nucleus (SCN) (Fig. 4g). Although the presence of 15 mM glucose in the culture medium may elevate baseline extracellular lactate, bath application of L-lactate produced fluorescence increases in R-eLACCO2.1 that were significantly greater than those in R-deLACCOctrl (Fig. 4h–j).
Collectively, these results demonstrate that R-eLACCO variants with optimized signal peptides and anchoring domains enable robust imaging of extracellular L-lactate on cultured neurons, cultured astrocytes, and cells in acute brain slices.
Figure 4. Validation of R-eLACCO2 variants in neural cells and brain tissue.
In Vivo Validation in Awake Mice
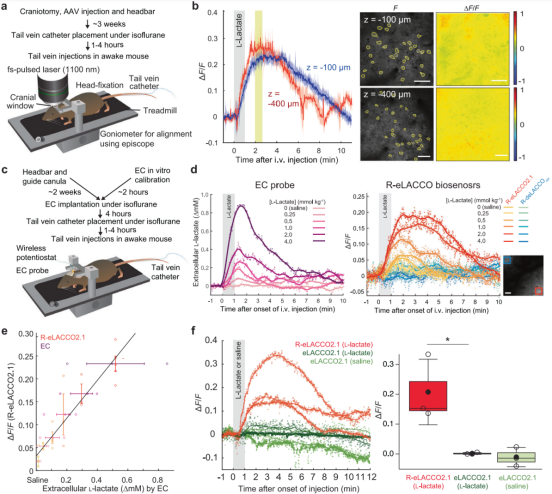
To evaluate the in vivo performance of R-eLACCO2.1, researchers injected AAV encoding hSyn-R-eLACCO2.1 into the vS1 cortex of adult mice (Fig. 5a). Intravenously delivered L-lactate is known to cross the blood–brain barrier; following tail-vein injection in awake mice, two-photon adaptive optics scanning microscopy (AO2P) revealed robust fluorescence increases from R-eLACCO2.1 at depths of 100 μm and 400 μm (Fig. 5b).
To further confirm its ability to monitor extracellular L-lactate dynamics, the team simultaneously recorded R-eLACCO2.1 fluorescence and electrochemical (EC) L-lactate signals from an EC probe implanted in vS1 after in vitro calibration (Fig. 5c–d). Both the fluorescent and EC signals rose and fell in accordance with lactate concentrations; saline injections produced small R-eLACCO2.1 responses for unknown reasons (Fig. 5d). Imaging showed a strong correlation between R-eLACCO2.1 fluorescence and EC probe signals (Fig. 5e), confirming the sensor’s ability to report extracellular L-lactate. In vivo, R-eLACCO2.1 exhibited stronger fluorescence responses to systemic lactate injection compared with the GFP-based sensor eLACCO2.1 (Fig. 5f). Together, these data establish R-eLACCO2.1 as a robust extracellular L-lactate sensor in vivo.
Figure 5. Validation of R-eLACCO2.1 in awake mice.
In Vivo Multichannel L-Lactate Imaging
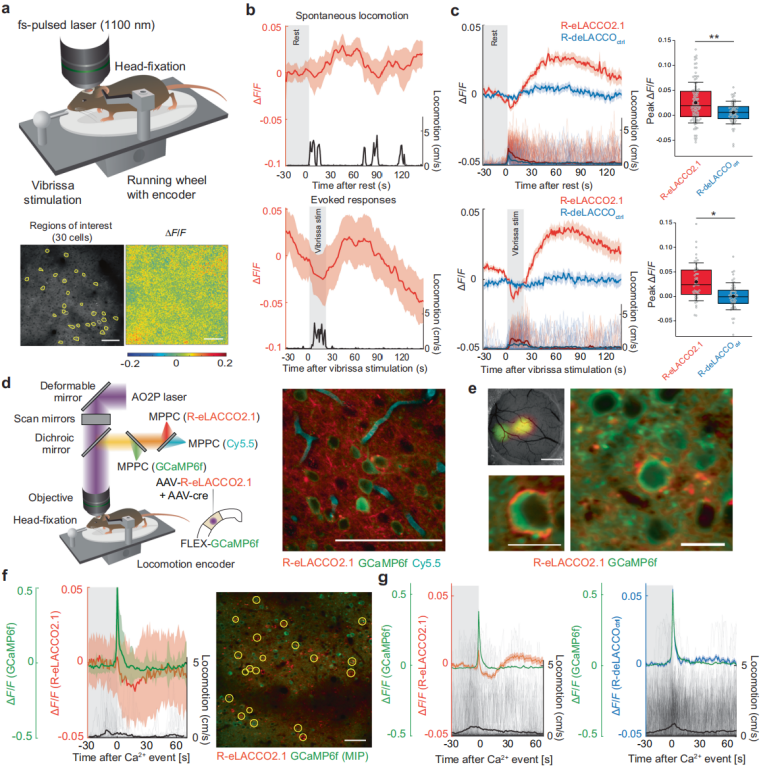
To monitor endogenous extracellular L-lactate dynamics in awake mice, the researchers expressed R-eLACCO2.1 in vS1 cortical neurons and simultaneously recorded fluorescence and locomotion during airflow whisker stimulation (Fig. 6a). In layer II/III neurons, whisker stimulation increased both R-eLACCO2.1 fluorescence and locomotor activity (Fig. 6b). Long-duration imaging confirmed fluorescence stability, indicating that the observed changes reflected lactate dynamics rather than photobleaching.
After 30 seconds of rest, spontaneous locomotion produced R-eLACCO2.1 fluorescence increases comparable to those elicited by 20 seconds of whisker stimulation (Fig. 6c), suggesting that the fluorescence during stimulation was primarily movement-related. Whisker stimulation that did not induce movement produced only small fluorescence changes. Notably, whisker stimulation-induced vasodilation and functional hyperemia increased absorption of excitation/emission light, leading to apparent fluorescence decreases (Fig. 6b–c). In vivo imaging also showed that the sensor could detect decreases in extracellular lactate back to baseline after movement, demonstrating its ability to monitor endogenous lactate dynamics with cellular resolution.
Finally, to investigate the relationship between neural activity and metabolism, the researchers used multichannel AO2P imaging. They injected a mixture of AAV-hSyn-R-eLACCO2.1 and AAV-hSyn-Cre into transgenic FLEX-GCaMP6f mice (Fig. 6d). Wide-field one-photon and AO2P imaging confirmed proper in vivo localization: R-eLACCO2.1 on the cell membrane and GCaMP6f in the soma (excluding nuclei) (Fig. 6e). In the absence of overt movement, spontaneous neural activation was followed by a dip and subsequent recovery of extracellular lactate (Fig. 6f–g). Thus, R-eLACCO2.1 enables simultaneous monitoring of endogenous extracellular L-lactate dynamics and neuronal activity in awake mice.
Figure 6. In vivo L-lactate dynamics during neural activity.
Conclusion
R-eLACCO2.1 emits red fluorescence and is fully compatible with green indicators such as GCaMP, enabling multiplexed “lactate–neural activity” imaging. It offers superior responsiveness to lactate elevations in vivo compared with green probes, detects lactate decreases below baseline, and supports both fluorescence-intensity imaging and fluorescence-lifetime imaging (FLIM).
Service Type :
Select the service you'd like to purchase.
Order Information(Premade-AAVs)
Please provide us some information about the service you'd like to order.
Order Information(Custom AAV/Lentivirus)
Please provide us some information about the service you'd like to order.
Order Information(Others)
Please provide us some information about the service you'd like to order.