Characterization of eLACCO2.1 in Live Mammalian Cells and Acute Brain Slices
When expressed in mammalian cells, HA-eLACCO2.1-NGR shows robust membrane localization (Fig. 2a), whereas CD59-eLACCO1.1-CD59 forms fluorescent puncta. In HeLa cells expressing eLACCO2.1, application of 10 mM L-lactate markedly increases fluorescence, yielding ΔF/F = 8.8 ± 0.2 (Fig. 2b, c), which is 138% of eLACCO1.1 (ΔF/F = 6.4 ± 0.2, Fig. 3c). The control sensor deLACCO1 localizes correctly to the membrane but shows no response to L-lactate (Fig. 2a–d). The apparent in situ Kd of eLACCO2.1 for L-lactate is 580 μM (Fig. 2d). eLACCO2.1’s fluorescence is Ca²⁺-dependent, with an apparent Ca²⁺ Kd of 270 μM, far below the extracellular Ca²⁺ concentration in brain tissue (1.5–1.7 mM) and serum (0.9–1.3 mM) (Fig. 2e). Kinetic measurements show that eLACCO2.1 responds faster than eLACCO1.1 (Fig. 2f).
In the absence of L-lactate, eLACCO2.1 exhibits photostability comparable to EGFP and superior to eLACCO1.1; in the presence of L-lactate, its photostability is lower than that of eLACCO1.1 (Fig. 2g). deLACCO1 displays consistently lower photostability than EGFP.
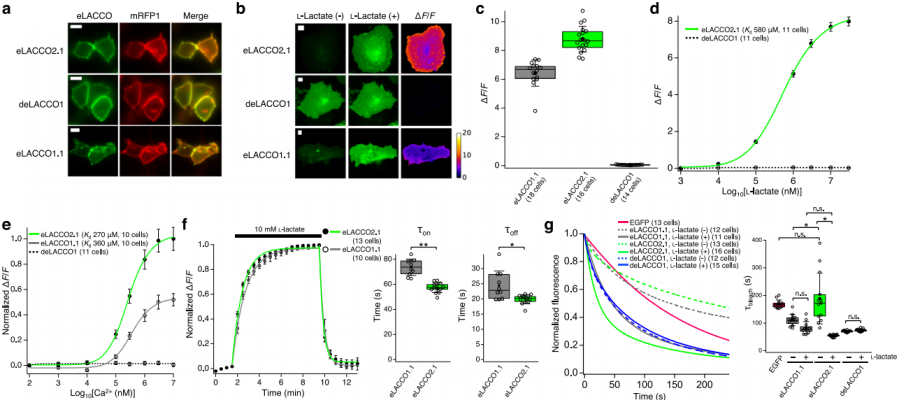
Fig. 2 | Characterization of eLACCO2.1 in HeLa cells
To assess eLACCO2.1 performance on neuronal membranes, HA-eLACCO2.1-NGR driven by the hSyn promoter was expressed in rat primary cortical/hippocampal neurons, resulting in bright membrane fluorescence. In contrast, CD59-eLACCO1.1-CD59 showed punctate fluorescence (Fig. 3h). Upon addition of 10 mM L-lactate, eLACCO2.1 produced ΔF/F = 8.1 ± 0.7, which is 5.4-fold higher than eLACCO1.1 (ΔF/F = 1.5 ± 0.2) (Fig. 3i–j).
To determine whether eLACCO2.1 can detect extracellular L-lactate changes on astrocyte membranes, the sensor was expressed in rat primary cortical/hippocampal astrocytes under the gfaABC1D promoter (Fig. 3h). After application of 10 mM L-lactate, eLACCO2.1 showed ΔF/F = 7.3 ± 1.0 (Fig. 3i, k), outperforming eLACCO1.1 (ΔF/F = 4.9 ± 0.5). deLACCO1 remained nonresponsive.
Together, these results demonstrate that the optimized signal peptide and membrane-anchoring strategy substantially enhance eLACCO2.1 performance, enabling imaging of extracellular L-lactate dynamics on both neurons and astrocytes.
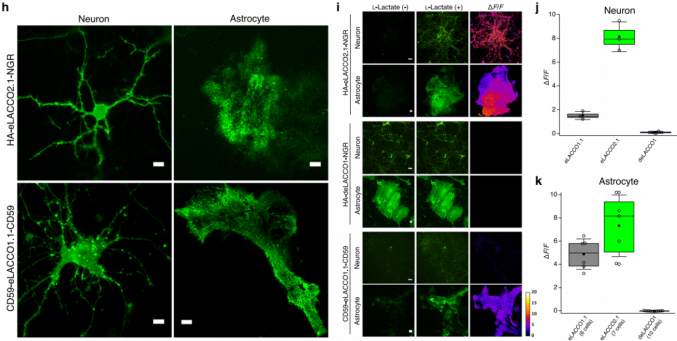 Fig. 3 | Characterization of eLACCO2.1 in neurons and astrocytes
To test whether eLACCO2.1 can detect endogenous extracellular L-lactate changes in intact tissue, AAV expressing HA-eLACCO2.1-NGR under the hSyn promoter was delivered into the mouse neocortex (Fig. 4l). In ex vivo brain-slice experiments, glucose deprivation decreased eLACCO2.1 fluorescence (Fig. 4m), consistent with extracellular L-lactate uptake. Conversely, theta-burst stimulation (a defined electrical stimulation pattern) caused a robust fluorescence increase that persisted for at least 15 minutes (Fig. 4n), in agreement with reports that high-frequency activity elevates extracellular L-lactate. Taken together, these results demonstrate that eLACCO2.1 reliably detects endogenous extracellular L-lactate dynamics in intact brain tissue.
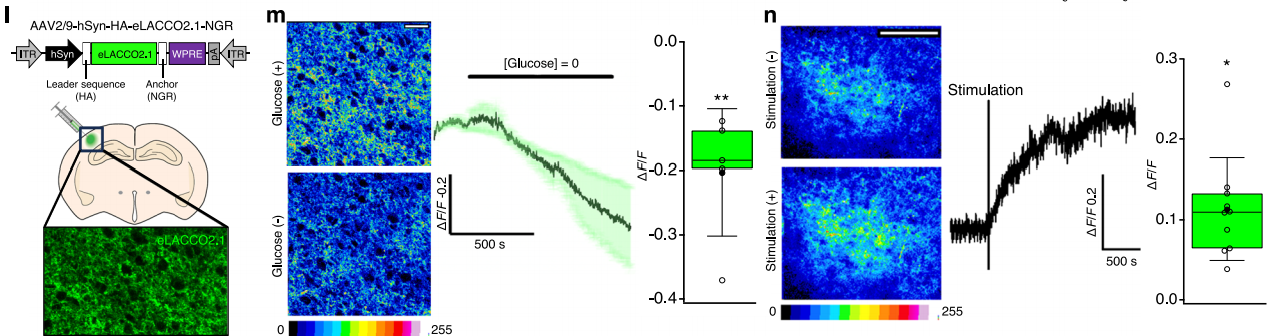
Fig. 4 | Characterization of eLACCO2.1 in acute brain slices
Characterization of R-iLACCO1 in Live Mammalian Cells
To evaluate the ability of the R-iLACCO variants to monitor endogenous intracellular L-lactate dynamics in mammalian cells, live-cell imaging was performed across multiple cell types and stimulation conditions, with comparisons to established L-lactate sensors (Fig. 5g–j). In glucose-starved cells, glucose addition enhances glycolysis and increases intracellular L-lactate, leading to fluorescence increases in all R-iLACCO variants (Fig. 5g). Among them, the low-affinity variant R-iLACCO1.2 showed the strongest response—substantially exceeding all other sensors.
Inhibition of monocarboxylate transporters (MCTs) prevents the efflux of L-lactate, thereby elevating intracellular L-lactate levels. In HeLa cells treated with the MCT inhibitor AR-C155858, the ΔF/F values of R-iLACCO1 / R-iLACCO1.1 / R-iLACCO1.2 were 0.08 ± 0.01, 0.19 ± 0.03, and 0.30 ± 0.02, respectively (Fig. 5h), with R-iLACCO1.2 exhibiting a response second only to iLACCO1.
In primary neurons and astrocytes treated with AR-C155858, fluorescence from all R-iLACCO variants increased markedly (Fig. 5i, j). Although increases in intracellular L-lactate are often accompanied by intracellular acidification—which can attenuate fluorescent protein signals—the R-iLACCO sensors consistently exhibited strong fluorescence increases under all conditions tested (Fig. 5).
Taken together, these results demonstrate that the R-iLACCO variants offer clear advantages and strong utility for monitoring intracellular L-lactate dynamics in mammalian cells.
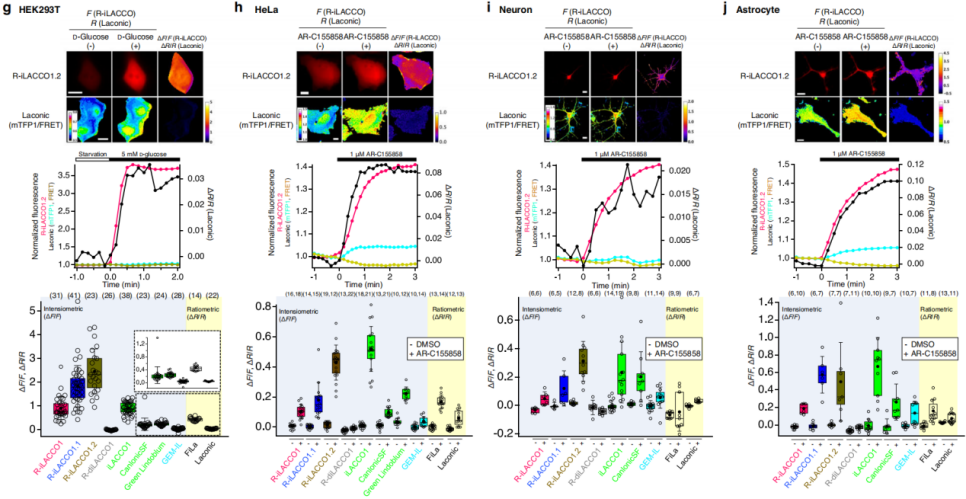 Fig. 5 | Characterization of R-iLACCO variants in mammalian cells
In Vivo Imaging of eLACCO2.1 and R-iLACCO1.1 in Mice
To assess the in vivo performance of eLACCO2.1, fluorescence responses were measured in neurons of the visual cortex of awake mice following intracerebroventricular (i.c.v.) injection of L-lactate (Fig. 6a). Compared with saline, L-lactate induced a robust fluorescence increase in eLACCO2.1 (Fig. 6b), whereas the control sensor deLACCO1 showed virtually no change (Fig. 6c), demonstrating that eLACCO2.1 functions as an effective extracellular L-lactate sensor in vivo.
To evaluate whether eLACCO2.1 can detect endogenous L-lactate dynamics in freely moving mice—given that insulin injection is known to reduce extracellular L-lactate levels in the mouse brain—eLACCO2.1 was expressed in hippocampal neurons, and fluorescence was recorded following intraperitoneal (i.p.) insulin administration (Fig. 6d). Relative to saline controls, insulin significantly decreased eLACCO2.1 fluorescence, while deLACCO1 exhibited no notable change (Fig. 6e), indicating that eLACCO2.1 can monitor endogenous L-lactate dynamics in freely behaving mice.
To validate the ability of R-iLACCO1.1 to monitor intracellular L-lactate in vivo—based on the known increase in intracellular L-lactate within somatosensory cortical neurons during whisker stimulation—R-iLACCO1.1 was expressed in the somatosensory cortex and fluorescence responses were measured following whisker stimulation (Fig. 6f–g). Imaging under light anesthesia showed stimulus-dependent fluorescence increases in R-iLACCO1.1 (Fig. 6h–i), confirming its ability to monitor endogenous intracellular L-lactate dynamics in live mice.
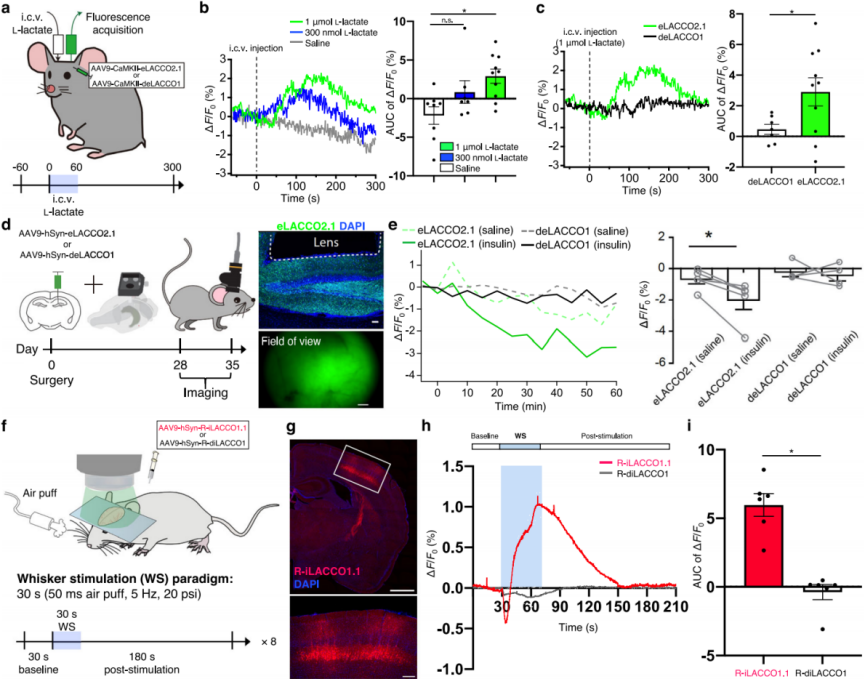
Fig. 6 | In vivo imaging of L-lactate in mice
Spectral and Spatially Multiplexed Imaging of L-Lactate in Glioblastoma Cells
To visualize both cytosolic L-lactate production and its extracellular release in glioblastoma cells, eLACCO2.1 (for extracellular imaging) and R-iLACCO1.2 (for intracellular imaging) were co-expressed in glucose-starved cells (Fig. 7a). Upon glucose stimulation, the fluorescence of both sensors increased simultaneously (Fig. 7b–c), indicating that newly synthesized cytosolic L-lactate is rapidly exported to the extracellular space. A transient peak in intracellular L-lactate was observed, during which the slope of the extracellular signal markedly decreased. Because this transient peak was almost abolished in the presence of an MCT inhibitor, it is likely caused by a balance between cytosolic L-lactate production and MCT-mediated efflux.
To examine the shuttling of L-lactate between the cytosol and organelles, R-iLACCO1.2 was targeted to the mitochondrial matrix or the endoplasmic reticulum (ER), and co-expressed with cytosolic iLACCO1 in glucose-starved cells (Fig. 7d–i). Following glucose stimulation, R-iLACCO1.2 fluorescence increased in both the mitochondrial matrix and ER, in parallel with cytosolic iLACCO1, demonstrating that cytosol-generated L-lactate is not only exported outside the cell but also trafficked into mitochondria and the ER.
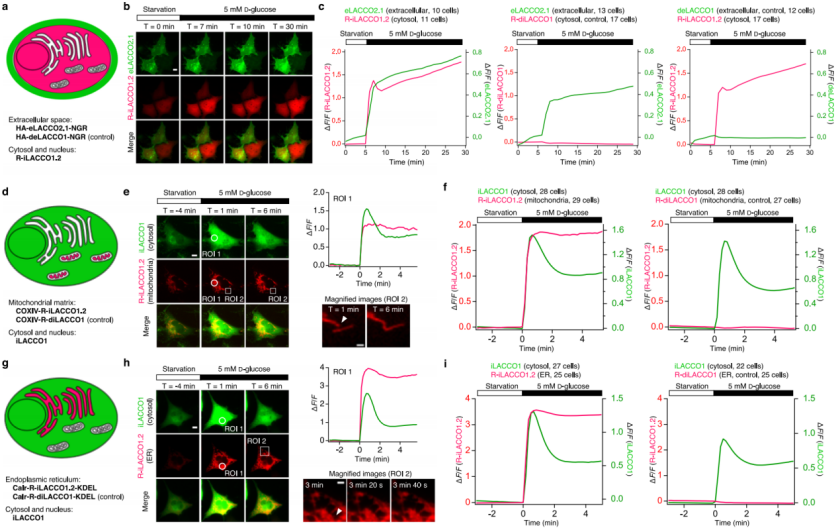
Fig. 7 | Spectral and spatial multiplexed imaging of L-lactate
Conclusion
R-iLACCO1 fills the longstanding gap in red fluorescent intracellular L-lactate sensors, resolving spectral overlap issues. eLACCO2.1 substantially outperforms the first generation, enabling dynamic extracellular L-lactate monitoring in vivo. Together, these tools provide high-resolution approaches for studying neuro-metabolism (e.g., the ANLS hypothesis), tumor Warburg metabolism, and other lactate-related biological processes.
Those interested in eLACCO2.1 are welcome to reach out to us at bd@ebraincase.com for construction and AAV-packaging services.