Literature Highlight | “Red–Green Sensors” Enable Full-Field, Dynamic Visualization of L-Lactate Metabolism
Release time:2025-11-17 15:02:09
L-lactate is no longer viewed as a metabolic waste product; instead, it is a key energy source and signaling molecule involved in neuronal processes (e.g., the ANLS hypothesis), tumor microenvironments, and immune regulation. There is an urgent need to study its dynamics across cellular and subcellular compartments. The first-generation extracellular sensor eLACCO1.1, developed in 2021, suffered from membrane clustering and a weak fluorescence response (ΔF/F = 4). Existing intracellular sensors are all green fluorescent, making them incompatible with green tools such as GCaMP, and they also show limited response amplitudes.
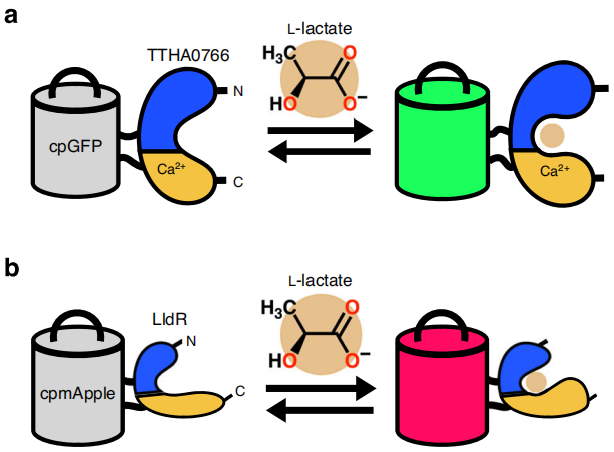
A 2023 Nature Communications article, “Lactate biosensors for spectrally and spatially multiplexed fluorescence imaging,” reports the development of two spectrally and functionally orthogonal genetically encoded L-lactate fluorescent biosensors (Fig. 1): eLACCO2.1, a second-generation green fluorescent extracellular sensor, and R-iLACCO1, the first red fluorescent intracellular sensor.
eLACCO2.1 is engineered from the TTHA0766 protein and optimized through directed evolution, achieving ΔF/F = 14 (3.5× that of eLACCO1.1). Using an HA signal peptide and an NGR GPI anchor, it attains efficient membrane localization. With a Kd of 1.9 mM—well-suited for extracellular physiological levels—it can monitor extracellular L-lactate dynamics in brain slices and live mice.
R-iLACCO1 is based on the LldR protein with an inserted cpmApple module, achieving a ΔF/F of 20 (the highest among existing intracellular sensors). Affinity-tuned variants, R-iLACCO1.1 and R-iLACCO1.2 (Kd = 3.0 mM and 4.0 mM, respectively), were also developed, and the sensor is Ca²⁺-independent.
Together, these probes enable spectrally and spatially multiplexed imaging of extracellular and intracellular L-lactate in cultured cells (e.g., HeLa cells, neurons), brain slices, and live mice. They also allowed the first observation of L-lactate shuttling between mitochondria and the endoplasmic reticulum, providing a powerful new toolkit for metabolic research.
Figure 1. Schematic diagrams of eLACCO and R-iLACCO and their response mechanisms to L-lactate.
Characterization of eLACCO2.1 in live mammalian cells and acute brain slices
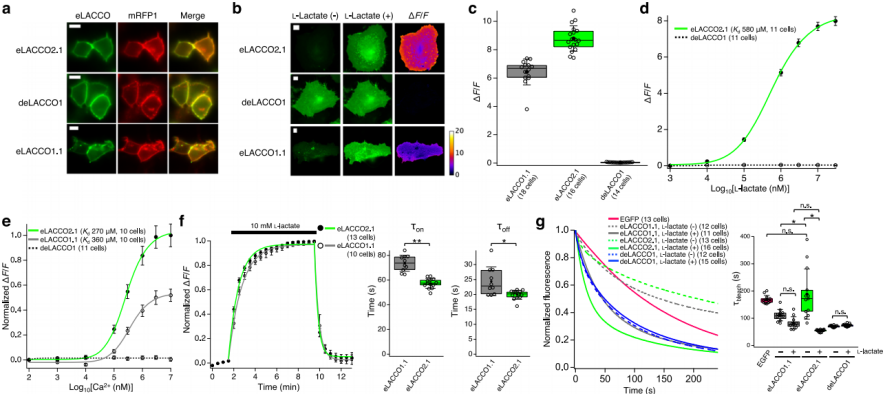
When HA-eLACCO2.1-NGR was expressed in mammalian cells, it displayed robust membrane localization (Fig. 2a), whereas CD59-eLACCO1.1-CD59 formed fluorescent puncta. Upon application of 10 mM L-lactate to HeLa cells expressing eLACCO2.1, fluorescence intensity increased markedly, with ΔF/F = 8.8 ± 0.2 (Fig. 2b, c), which is 138% of that of eLACCO1.1 (ΔF/F = 6.4 ± 0.2; Fig. 3c). The control sensor deLACCO1 localized normally to the membrane but showed no response to L-lactate (Fig. 2a–d). The apparent on-cell Kd for L-lactate was 580 μM for eLACCO2.1 (Fig. 2d). eLACCO2.1 fluorescence is Ca²⁺-dependent, with an apparent Ca²⁺ Kd of 270 μM—substantially lower than extracellular Ca²⁺ levels in brain tissue (1.5–1.7 mM) or serum (0.9–1.3 mM) (Fig. 2e). Kinetic measurements showed that eLACCO2.1 responds faster than eLACCO1.1 (Fig. 2f). In the absence of L-lactate, the photostability of eLACCO2.1 was comparable to EGFP and higher than that of eLACCO1.1; in the presence of L-lactate, its photostability was lower than eLACCO1.1 (Fig. 2g). deLACCO1 consistently showed lower photostability than EGFP.
Figure 2. Characterization of eLACCO2.1 in HeLa cells
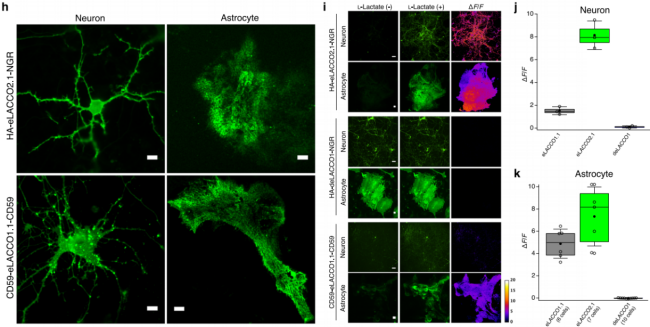
To assess eLACCO2.1 performance on neuronal membranes, HA-eLACCO2.1-NGR, driven by the hSyn promoter, exhibited bright membrane fluorescence in rat primary cortical/hippocampal neurons, whereas CD59-eLACCO1.1-CD59 formed puncta (Fig. 3h). After application of 10 mM L-lactate, eLACCO2.1 showed ΔF/F = 8.1 ± 0.7, which is 5.4-fold higher than eLACCO1.1 (ΔF/F = 1.5 ± 0.2; Fig. 3i–j).
To evaluate whether eLACCO2.1 can detect changes in L-lactate concentrations on astrocyte membranes, eLACCO2.1 driven by the gfaABC1D promoter was efficiently expressed in rat primary cortical/hippocampal astrocytes (Fig. 3h). Application of 10 mM L-lactate produced ΔF/F = 7.3 ± 1.0 (Fig. 3i, k), outperforming eLACCO1.1 (ΔF/F = 4.9 ± 0.5), while deLACCO1 again showed no response. Together, these results demonstrate that the optimized targeting sequence and anchoring domain greatly enhance eLACCO2.1 performance, enabling imaging of extracellular L-lactate dynamics on neuron and astrocyte surfaces.
Figure 3. Characterization of eLACCO2.1 in neurons and astrocytes
To determine whether eLACCO2.1 can monitor endogenous extracellular L-lactate changes in intact tissue, AAV expressing HA-eLACCO2.1-NGR under the hSyn promoter was delivered into the mouse neocortex (Fig. 4l). In ex vivo brain slice experiments, glucose deprivation caused a decrease in eLACCO2.1 fluorescence (Fig. 4m), consistent with extracellular L-lactate uptake. Theta-burst stimulation (a specific pattern of electrical stimulation) produced a pronounced fluorescence increase that persisted for 15 minutes (Fig. 4n), consistent with reports that high-frequency stimulation elevates extracellular L-lactate. These findings show that eLACCO2.1 can detect endogenous extracellular L-lactate dynamics in intact tissue.
Figure 4. Characterization of eLACCO2.1 in acute brain slices
Characterization of R-iLACCO1 in live mammalian cells
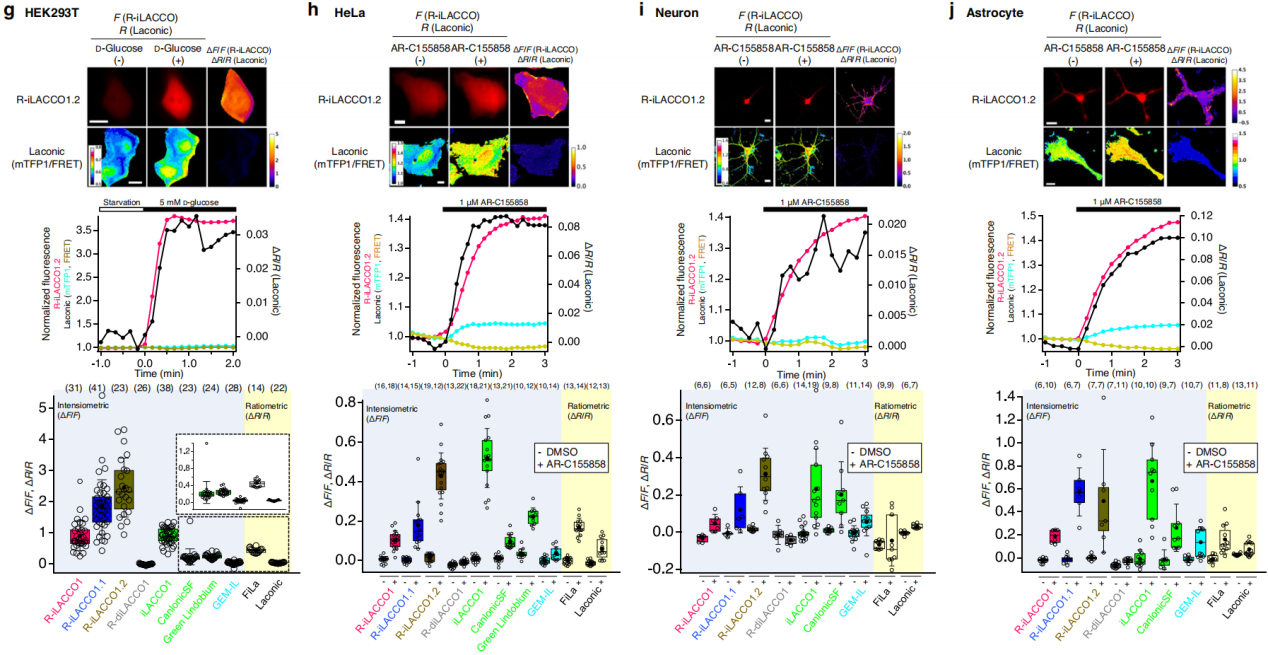
To evaluate the ability of the R-iLACCO variants to monitor endogenous intracellular L-lactate dynamics in mammalian cells, live-cell imaging was performed across multiple cell types and stimulation conditions, and results were compared with known L-lactate sensors (Fig. 5g–j). In glucose-starved cells, glucose addition enhances glycolysis and elevates intracellular L-lactate; fluorescence from all R-iLACCO variants increased accordingly (Fig. 5g). Among them, the low-affinity variant R-iLACCO1.2 showed the strongest response, far exceeding other sensors.
Inhibitors of monocarboxylate transporters (MCTs) block L-lactate efflux and thereby raise intracellular L-lactate concentrations. Upon treatment of HeLa cells with the MCT inhibitor AR-C155858, the ΔF/F values of R-iLACCO1/1.1/1.2 were 0.08 ± 0.01, 0.19 ± 0.03, and 0.30 ± 0.02, respectively (Fig. 5h), with R-iLACCO1.2 showing a response second only to iLACCO1. In primary neurons and astrocytes treated with AR-C155858, fluorescence from all R-iLACCO variants increased markedly (Fig. 5i, j).
Although increases in intracellular L-lactate are often accompanied by decreases in pH (which can potentially reduce fluorescent protein signal), the R-iLACCO variants consistently exhibited robust fluorescence increases under all tested conditions (Fig. 5).
Together, these results demonstrate that the R-iLACCO variants offer significant advantages and strong utility for monitoring intracellular L-lactate dynamics in mammalian cells.
Figure 5. Characterization of R-iLACCO variants in mammalian cells
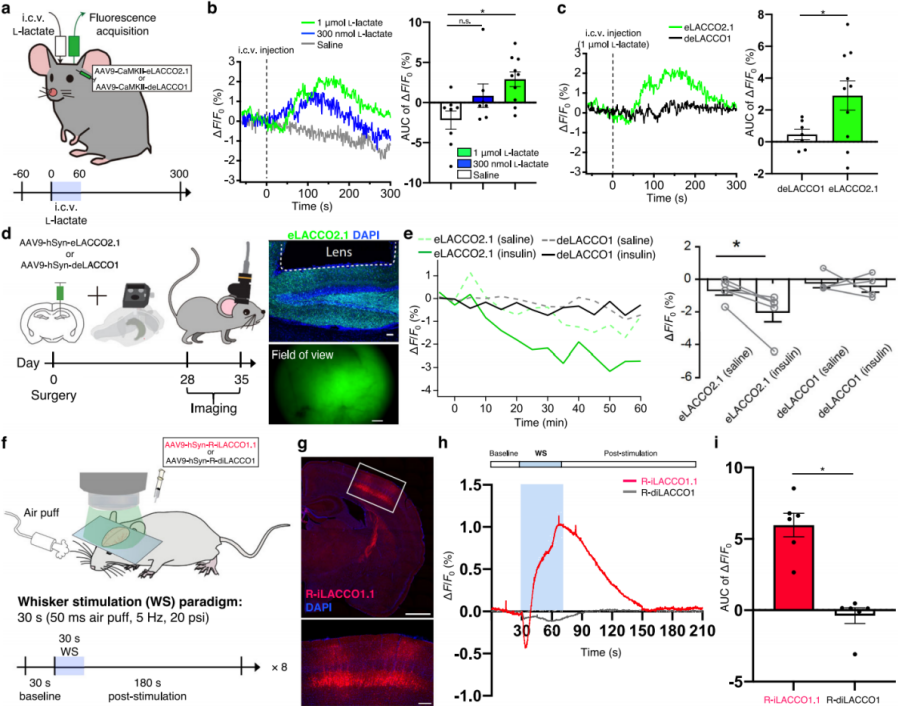
In vivo imaging of eLACCO2.1 and R-iLACCO1.1 in mice
To evaluate in vivo performance of eLACCO2.1, fluorescence responses were measured in neurons of the visual cortex of awake mice following intracerebroventricular (i.c.v.) injection of L-lactate (Fig. 6a). Compared with saline controls, the L-lactate group showed a robust fluorescence increase in eLACCO2.1 (Fig. 6b), while the control sensor deLACCO1 exhibited almost no change (Fig. 6c), demonstrating that eLACCO2.1 functions as an effective extracellular L-lactate sensor in vivo.
To assess whether eLACCO2.1 can detect endogenous L-lactate dynamics in freely moving mice—given that insulin injections are known to decrease extracellular L-lactate in the brain—eLACCO2.1 was expressed in hippocampal neurons, and fluorescence changes were monitored following intraperitoneal (i.p.) injection of insulin (Fig. 6d). Relative to saline, insulin administration produced a significant decrease in eLACCO2.1 fluorescence, whereas deLACCO1 showed minimal change (Fig. 6e), indicating that eLACCO2.1 can report endogenous extracellular L-lactate dynamics in freely behaving animals.
To examine the ability of R-iLACCO1.1 to monitor intracellular L-lactate in vivo—given that whisker stimulation is known to elevate intracellular L-lactate in somatosensory cortex neurons—R-iLACCO1.1 was expressed in neurons of the mouse somatosensory cortex, and fluorescence responses were recorded following whisker stimulation (Fig. 6f–g). Imaging in lightly anesthetized mice revealed stimulation-dependent increases in R-iLACCO1.1 fluorescence (Fig. 6h–i), demonstrating its capability to monitor endogenous intracellular L-lactate dynamics in vivo.
Figure 6. In vivo imaging of L-lactate in mice
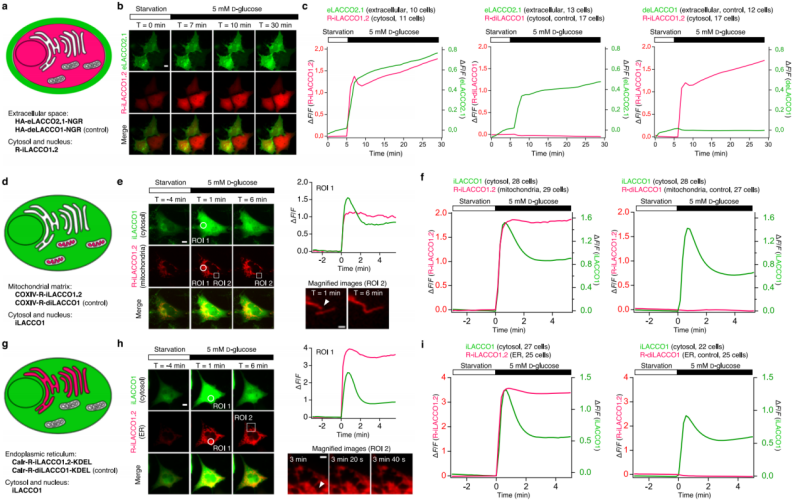
Spectral and spatial multiplexed imaging of L-lactate in glioblastoma cells
To visualize both cytosolic L-lactate production and its extracellular release in glioblastoma cells, eLACCO2.1 (for extracellular imaging) and R-iLACCO1.2 (for intracellular imaging) were co-expressed in glucose-starved cells (Fig. 7a). Upon glucose stimulation, both fluorescence signals increased simultaneously (Fig. 7b–c), indicating that newly produced cytosolic L-lactate is rapidly released to the extracellular space. Notably, intracellular L-lactate showed a transient peak, during which the slope of the extracellular signal markedly decreased. Because this transient peak almost disappeared in the presence of an MCT inhibitor, it is likely caused by the balance between cytosolic L-lactate production and MCT-mediated efflux.
To investigate L-lactate shuttling between the cytosol and organelles, R-iLACCO1.2 was targeted to the mitochondrial matrix or the endoplasmic reticulum (ER), and co-expressed with cytosolic iLACCO1 in glucose-starved cells (Fig. 7d–i). Following glucose application, fluorescence of mitochondrial- or ER-localized R-iLACCO1.2 increased in synchrony with cytosolic iLACCO1, demonstrating that cytosol-generated L-lactate is not only released extracellularly but also shuttles into the mitochondrial matrix and ER.
Figure 7. Spectral and spatial multiplexed imaging of L-lactate
Conclusion
R-iLACCO1 fills the gap in red intracellular L-lactate sensors, resolving long-standing spectral conflicts. eLACCO2.1 surpasses the first generation in all aspects, enabling dynamic monitoring of extracellular L-lactate in vivo. Together, these tools provide high-resolution approaches for studying neuro-metabolism (e.g., the ANLS hypothesis), the tumor Warburg effect, and related metabolic processes.
Brain Case can provide backbone plasmid construction and AAV packaging services related to R-iLACCO1. Please contact bd@ebraincase.com
Service Type :
Select the service you'd like to purchase.
Order Information(Premade-AAVs)
Please provide us some information about the service you'd like to order.
Order Information(Custom AAV/Lentivirus)
Please provide us some information about the service you'd like to order.
Order Information(Others)
Please provide us some information about the service you'd like to order.