To label monosynaptic long-range input neurons projecting to histaminergic neurons, a mixture of rAAV-EF1α-DIO-mCherry-F2A-TVA and rAAV-EF1α-DIO-oRVG (TVA:RVG = 1:2) was injected into the tuberomammillary nucleus (TMN) of HDC-CreERT2 mice — where histaminergic neurons are exclusively located and send axonal projections to nearly all major brain regions (Fig. 1a). One day after viral injection, tamoxifen (100 mg/kg) was administered intraperitoneally for five consecutive days to induce Cre recombinase activity. Three weeks later, RV-ENVA-ΔG-EGFP was injected into the same site (Fig. 1a). Cells co-labeled with TVA-mCherry and RV-EGFP were identified as starter cells (Fig. 1b, d), while RV-labeled upstream neurons exhibited distinct distribution patterns across multiple brain regions (Fig. 1c). Control experiments confirmed the specificity and reliability of this monosynaptic retrograde RV tracing method in HDC-CreERT2 mice.
To construct a precise and comprehensive whole-brain atlas of monosynaptic long-range inputs to histaminergic neurons, high-resolution whole-brain sectioning, imaging, and reconstruction were performed using the fMOST system (Fig. 1e). The standardized 3D whole-brain reconstruction was visualized through coronal, sagittal, horizontal, and whole-view projections (Fig. 1f), with representative coronal sections displayed at multiple rostrocaudal levels. Upstream neurons targeting histaminergic neurons exhibited three main spatial distribution patterns:
- Predominantly medial regions;
- Predominantly ventral regions;
- Concentrated along the anteroposterior axis from bregma 0 mm to –2.5 mm.
At the regional level (excluding the injection site), the hypothalamic nuclei contained the highest number of upstream cells, while the cerebellum showed the lowest density (Fig. 1g). Quantitative analysis revealed that the anterior hypothalamic nucleus (AHN) was the primary source of upstream inputs, with a significantly higher proportion than other regions (Fig. 1g). The striatum and globus pallidus also contributed substantial inputs, with key nuclei including the medial amygdaloid nucleus (MEA) within the striatum and the rostral part of the lateral septal nucleus (LSr). The distribution pattern within the bed nucleus of the stria terminalis (BNST) warrants further analysis (Fig. 1g).
Based on the observed heterogeneity in histaminergic neuron projections, the study further examined differences in input patterns among subpopulations projecting to distinct downstream regions. Results showed that histaminergic neuron subgroups projecting to the medial septum (MS) and superior colliculus (SC) both received dense inputs from the medial prefrontal cortex (mPFC) and LS. However, significant differences in input density were found between these subgroups and general TMN histaminergic neurons within mPFC and LS regions. In summary, histaminergic neurons with different efferent projections exhibit distinct integration patterns of upstream inputs from various brain regions.
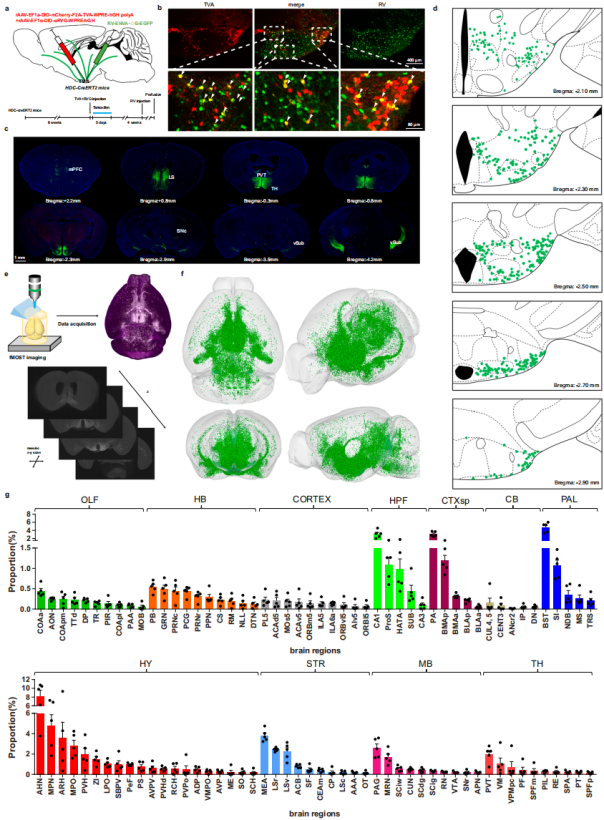 Figure 1. Whole-brain 3D reconstruction and visualization of long-range monosynaptic inputs to histaminergic neurons.
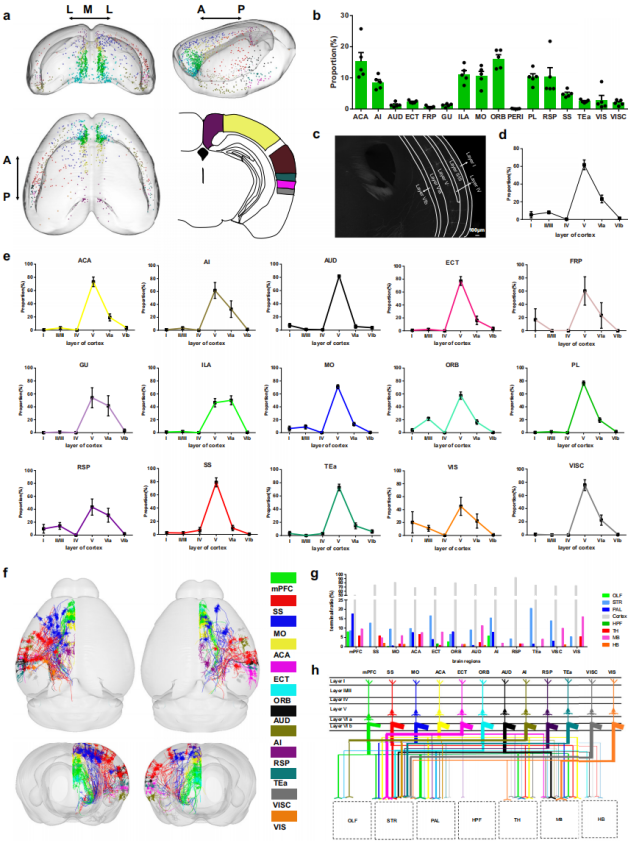
Layer-Specific Distribution and Co-Projection Features of Cortical Inputs to Histaminergic Neurons
The cortex plays a crucial role in emotional and sensory processing. Analysis of the fMOST raw data (Fig. 2c) and the whole-brain input atlas (Fig. 1g) revealed that cortical inputs projecting to histaminergic neurons are primarily distributed in layer V, indicating functional specificity. Three-dimensional visualization of cortical input neurons (Fig. 2a) showed that they are widely distributed across most cortical regions with varying densities (Fig. 2b). Quantitative analysis demonstrated that the majority of cortical inputs originate from layer V, followed by layer VIa, with sparse inputs from other layers (Fig. 2d). At the regional level, most cortical areas exhibited a layer V preference, except for the infralimbic area (ILA) of the medial prefrontal cortex (mPFC), where input density was higher in layer VIa (Fig. 2e).
To further elucidate the co-projection patterns of cortical input neurons and the mechanisms of whole-brain circuit regulation, single-cell morphological reconstructions were performed using fMOST data. A total of 150 well-reconstructed neurons were analyzed (Fig. 2f–h). Whole-cortex analysis revealed that, apart from projections to the hypothalamus and cortex, most input neurons co-project to multiple subcortical regions, mainly including the striatum, midbrain, globus pallidus, and thalamus (Fig. 2h). Moreover, all reconstructed neurons projected exclusively within the ipsilateral hemisphere (Fig. 2f).
Certain cortical regions displayed region-specific projection patterns. For instance, the entorhinal area was the only cortical region with co-projections to the hippocampal formation (HPF). The mPFC, orbitofrontal area (ORB), and agranular insular area (AI) were selectively connected with the olfactory bulb (OLF).
Comparative analysis of the co-projection patterns between the ILA and the prelimbic area (PL) within the mPFC showed distinct tendencies: ILA neurons preferentially co-projected to anterior regions such as the OLF and striatum (STR), whereas PL neurons preferentially co-projected to posterior regions such as the globus pallidus (PAL), thalamus (TH), and midbrain (MB). These findings suggest that these mPFC subregions participate in functionally distinct neural circuits.
Distinct Organizational Patterns of Inhibitory and Excitatory Inputs to Histaminergic Neurons
Histaminergic neurons broadly express GABA<sub>A</sub> and NMDA/AMPA receptors, mediating inhibitory and excitatory inputs to regulate histaminergic signaling. However, the precise distribution of GABAergic and glutamatergic neurons across most upstream brain regions remains unclear, hindering functional understanding. To address this, RNAscope in situ hybridization was performed on coronal sections of major upstream regions from RV-labeled mouse brains (Fig. 3a). GAD1 was used as a marker for GABAergic neurons, while vglut2 and CaMKIIα were used as markers for glutamatergic neurons (vglut2 being prevalent in subcortical regions and CaMKIIα suitable for cortex and hippocampus).
Quantitative analysis showed that RV-EGFP–labeled neurons in the lateral LS and medial amygdaloid nucleus (MEA) were predominantly GAD1-positive, with minimal vglut2/CaMKIIα signals, indicating inhibitory inputs (Fig. 3b, i, j). Similarly, in the bed nucleus of the stria terminalis (BST), most RV-labeled neurons co-expressed GAD1, with only a small fraction co-labeled with vglut2 (Fig. 3f, j). In contrast, neurons in the PVT, CA1 region, and posterior amygdaloid area (PA/BMAp) were primarily vglut2/CaMKIIα-positive, with negligible GAD1 expression, representing excitatory inputs (Fig. 3d, g, h, j). The periaqueductal gray (PAG) and anterior hypothalamic area (AHY) exhibited mixed inputs, containing substantial populations of both GAD1-positive and vglut2/CaMKIIα-positive neurons (Fig. 3c, e, j). Spatial mapping revealed that in AHY, GABAergic input neurons were broadly distributed, while glutamatergic neurons were concentrated near the third ventricle. In PAG, GABAergic neurons preferred ventral and lateral regions, whereas glutamatergic neurons were evenly distributed.
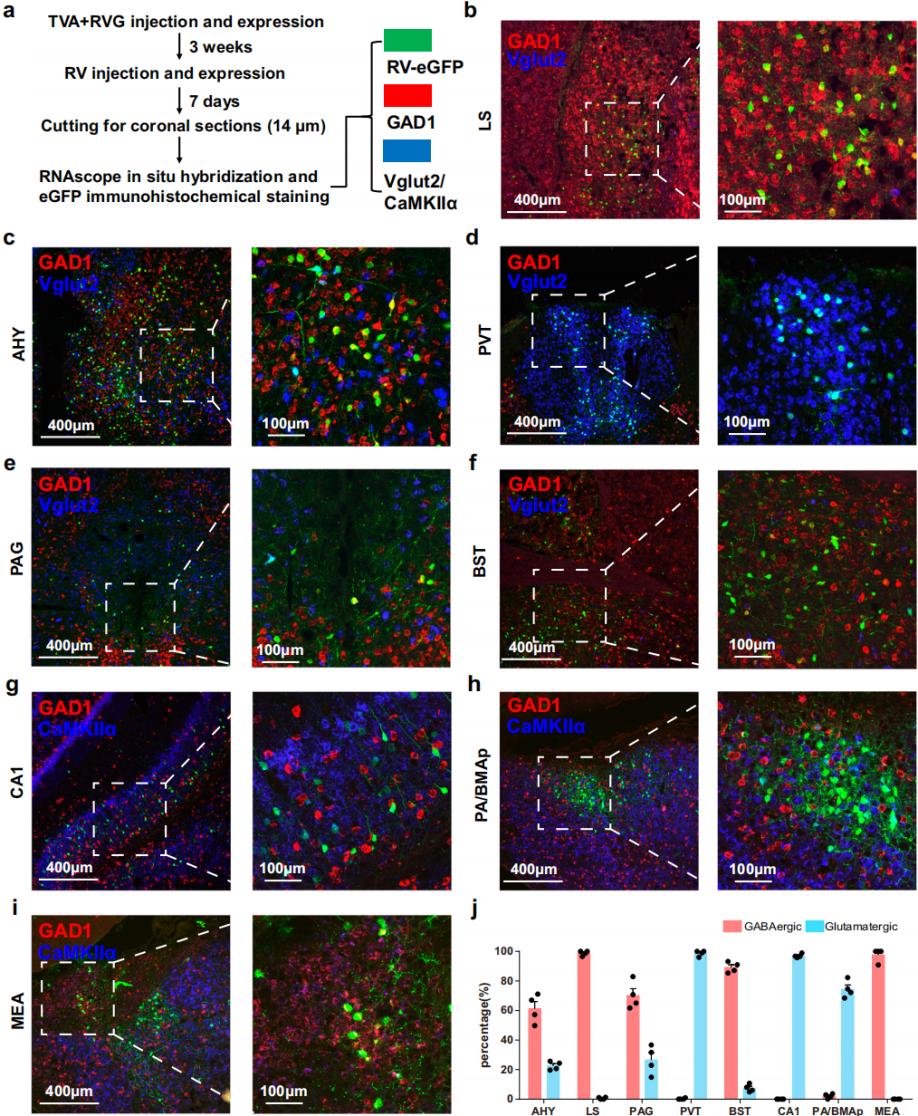 Figure 3. Excitatory and inhibitory inputs to histaminergic neurons from upstream brain regions.
Compared with studies of histaminergic output circuits, functional characterization of input circuits remains limited. Given the system’s pivotal role in sleep–wake regulation, the LS (mainly inhibitory) and PVT (mainly excitatory) were selected for further investigation, as both provide substantial inputs to histaminergic neurons and receive dense histaminergic projections—suggesting bidirectional functional relevance.
To verify direct connections, a Cre-dependent mWGA monosynaptic anterograde tracing system was employed. A viral mixture was injected into the bilateral LS of HDC; Ai47 mice (in which TMN histaminergic neurons express GFP) (Fig. 4a). Three weeks later, mWGA-mCherry/GFP co-labeled neurons were observed in the TMN, confirming monosynaptic LS→histaminergic neuron connections (Fig. 4b). Similar procedures applied to the PVT (Fig. 4c) also revealed co-labeled neurons in the TMN (Fig. 4d).
To characterize functional connectivity, whole-cell patch-clamp recordings were performed. In HDC;Ai47 mice, bilateral LS was injected with a ChrimsonR viral mixture (Fig. 4e). Upon 5-ms red-light stimulation, GFP-labeled histaminergic neurons displayed robust inhibitory postsynaptic currents (IPSCs), which persisted in TTX and 4-AP and were abolished by a GABA<sub>A</sub> receptor antagonist, confirming direct monosynaptic GABAergic transmission from LS to histaminergic neurons (Fig. 4f, g). Conversely, when the same virus was injected into PVT (Fig. 4h), 5-ms red-light stimulation evoked strong excitatory postsynaptic currents (EPSCs), which persisted in TTX and 4-AP but were eliminated by NMDA/AMPA receptor antagonists, verifying direct monosynaptic glutamatergic input from PVT to histaminergic neurons (Fig. 4i, j). These results provide both structural and functional evidence for direct LS/PVT→histaminergic neuron connections.
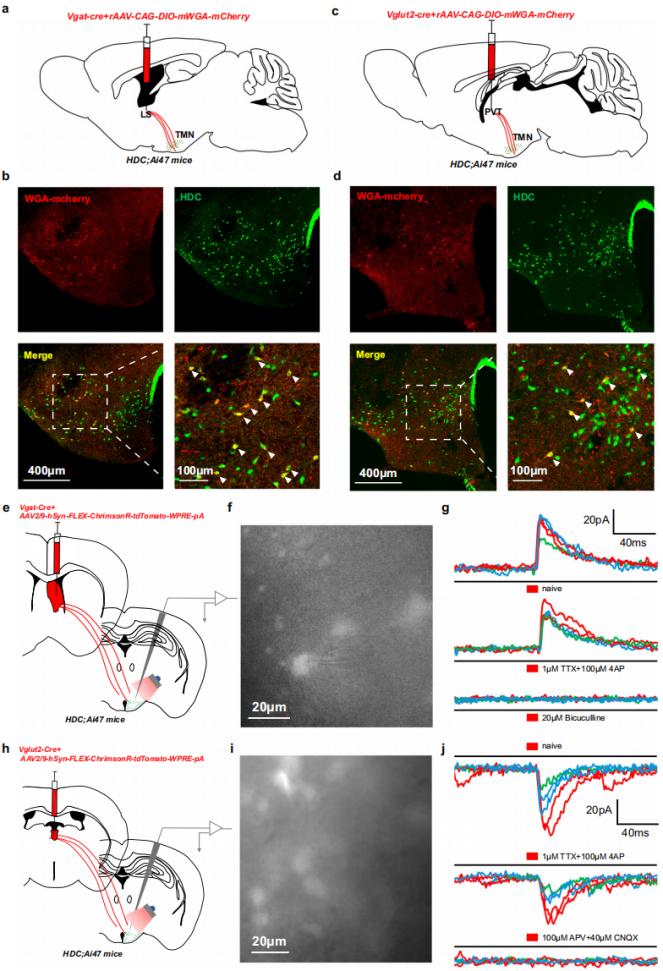
Figure 4. Structural and functional monosynaptic connections between LS/PVT neurons and TMN histaminergic neurons.
Balancing Roles of the LS–TMN and PVT–TMN Circuits in Sleep–Wake Regulation
The LS and PVT are densely innervated by histaminergic fibers and contain large populations of neurons projecting to histaminergic neurons, playing vital roles in modulating the core functions of the histaminergic system. Given the established involvement of the histaminergic system in sleep–wake regulation, and prior reports that PVT glutamatergic neurons and LS GABAergic neurons also participate in this process, the study aimed to address a paradox: how these functionally opposing nuclei appear to exert similar effects on sleep–wake transitions.
To identify LS and PVT neurons projecting to histaminergic neurons, a Cre-dependent monosynaptic retrograde GCaMP system was employed. A mixture of rAAV-EF1α-DIO-mCherry-F2A-TVA and rAAV-EF1α-DIO-N2cG (1:2) was injected into the bilateral TMN of HDC-CreERT2 mice. Three weeks later, CVS-EnvA-ΔG-GCaMP6s was injected into the same site, followed by optical fiber implantation in either the LS or PVT (Fig. 5a, e). GCaMP6s-labeled neurons were detected in both the TMN and upstream regions (Fig. 5b, c, f, g).
Simultaneous EEG/EMG recordings and fiber photometry revealed that during the wake-to-NREM sleep transition, calcium signals in LS and PVT input neurons decreased (Fig. 5d, h, i, m), while during NREM or REM sleep-to-wake transitions, their calcium activity increased (Fig. 5d, h, j, l, n, p). Interestingly, during NREM-to-REM sleep transitions, PVT neuron activity decreased, whereas LS neuron activity showed no significant change (Fig. 5d, h, k, o).
These findings suggest that LS and PVT neurons projecting to histaminergic neurons jointly regulate sleep–wake transitions, while exhibiting previously undescribed state-specific differences during the NREM-to-REM transition.
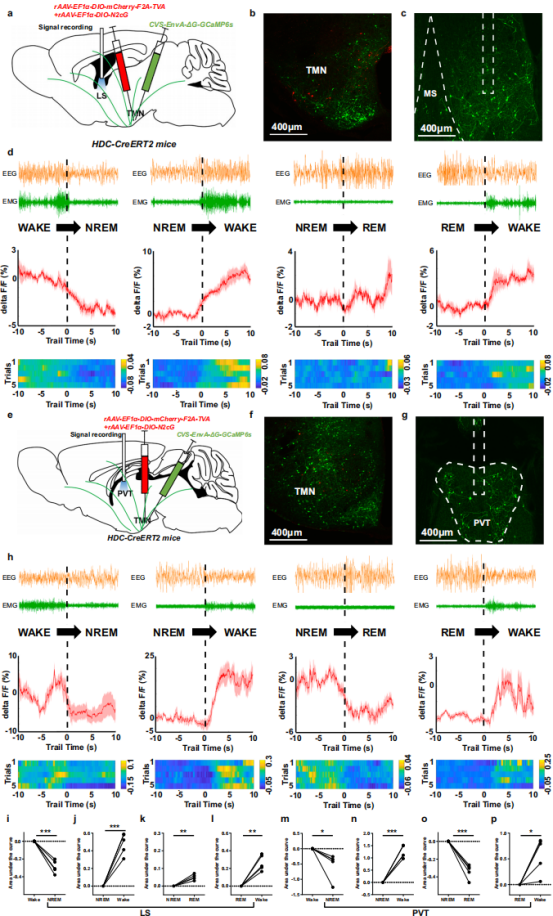 Figure 5. Differential Ca²⁺ dynamics of LS and PVT neurons targeting histaminergic neurons across the sleep–wake cycle.
The distinct functional dynamics during the NREM-to-REM transition suggest divergent regulatory roles of these input circuits. To further examine this, chemogenetic activation was used. A mixture of rAAV-VGAT1-Cre-EGFP and rAAV-DIO-hM3D(Gq)-EGFP was injected bilaterally into the LS of wild-type mice, while a mixture of rAAV-VGLUT2-Cre and rAAV-DIO-hM3D(Gq)-EGFP was injected into the PVT (Fig. 6a–d). After three weeks of expression, CNO was delivered through a cannula implanted in the TMN, and EEG/EMG recordings were performed.
Seven days of recording showed that both LS-hM3Dq and PVT-hM3Dq groups exhibited significantly increased wakefulness time compared with controls (Fig. 6e–i). However, REM sleep parameters showed striking differences: activation of the LS–TMN circuit increased REM sleep duration, whereas activation of the PVT–TMN circuit suppressed it (Fig. 6i, j). The frequency of NREM-to-REM transitions also differed significantly between groups (Fig. 6k).
Circadian analysis revealed two key patterns:
- All three groups displayed more wakefulness during the dark phase than the light phase (Fig. 6l, p);
- The LS-hM3Dq group showed increased REM sleep relative to controls, while the PVT-hM3Dq group exhibited decreased REM sleep (Fig. 6l–s).
Together, these results uncover fundamental differences in how the LS and PVT input circuits regulate sleep architecture, highlighting the complexity of histaminergic network modulation and providing a crucial foundation for understanding the circuit mechanisms underlying sleep–wake control.
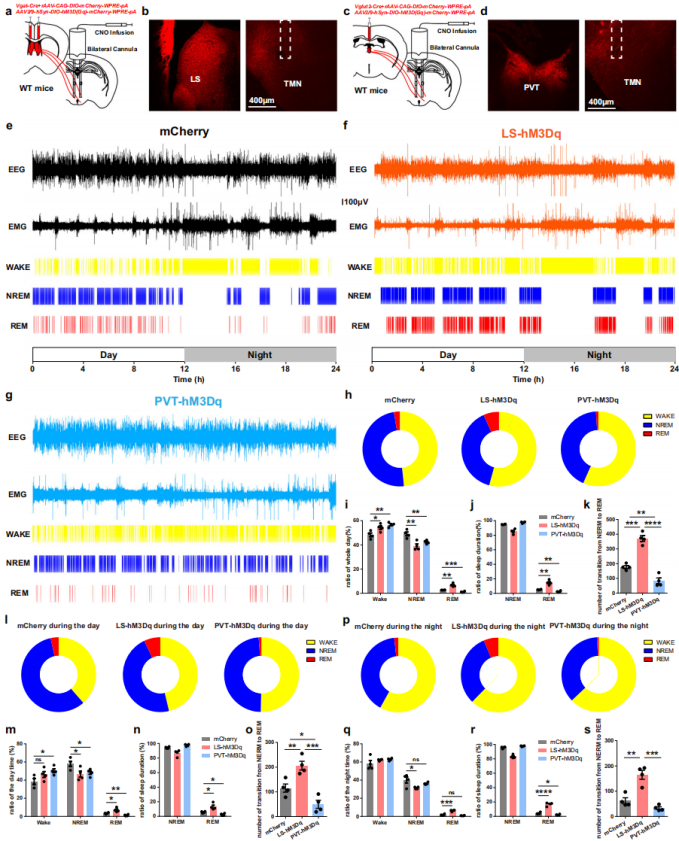 Figure 6. Balancing roles of the LS–TMN and PVT–TMN circuits in the regulation of sleep–wake transitions.
Summary
This study established a comprehensive and precise whole-brain monosynaptic input map of mouse histaminergic neurons, providing a solid foundation for future functional studies of histaminergic neural circuits. It revealed the roles of distinct upstream input pathways in regulating sleep–wake transitions, contributing to a deeper understanding of the complex functions of the histaminergic system. These findings offer new insights and references for exploring the pathogenesis and therapeutic strategies of related neurological disorders.
All viral tools used in this study
are available from Brain Case Biotech
(BD@ebraincase.com)